Mapped: Where American Income Has Grown the Most Over the Past 25 Years

A new home under construction in Nashville, Tennessee. Shutterstock


Connecting state and local government leaders
Explore the growth in average income by county, 1990 to 2015
As the Rust Belt stagnated, coastal metropolises thrived. As Appalachia sputtered, shale country boomed. As Southern manufacturing centers shut their doors, neighboring research hubs opened theirs.
These are just a few of the trends that have played out in regional economies across the U.S. over the past 25 years. This period includes the booms of the late 1990s and mid 2000s, a couple of mild recessions, one huge one, and the slow but steady growth of today. Nationally, workers’ average annual earnings rose by about 24% from 1990 to 2015, or from $42,800 to $52,300 in inflation-adjusted dollars. That works out to a 1.3% real annual raise every year—don’t spend it all at once!
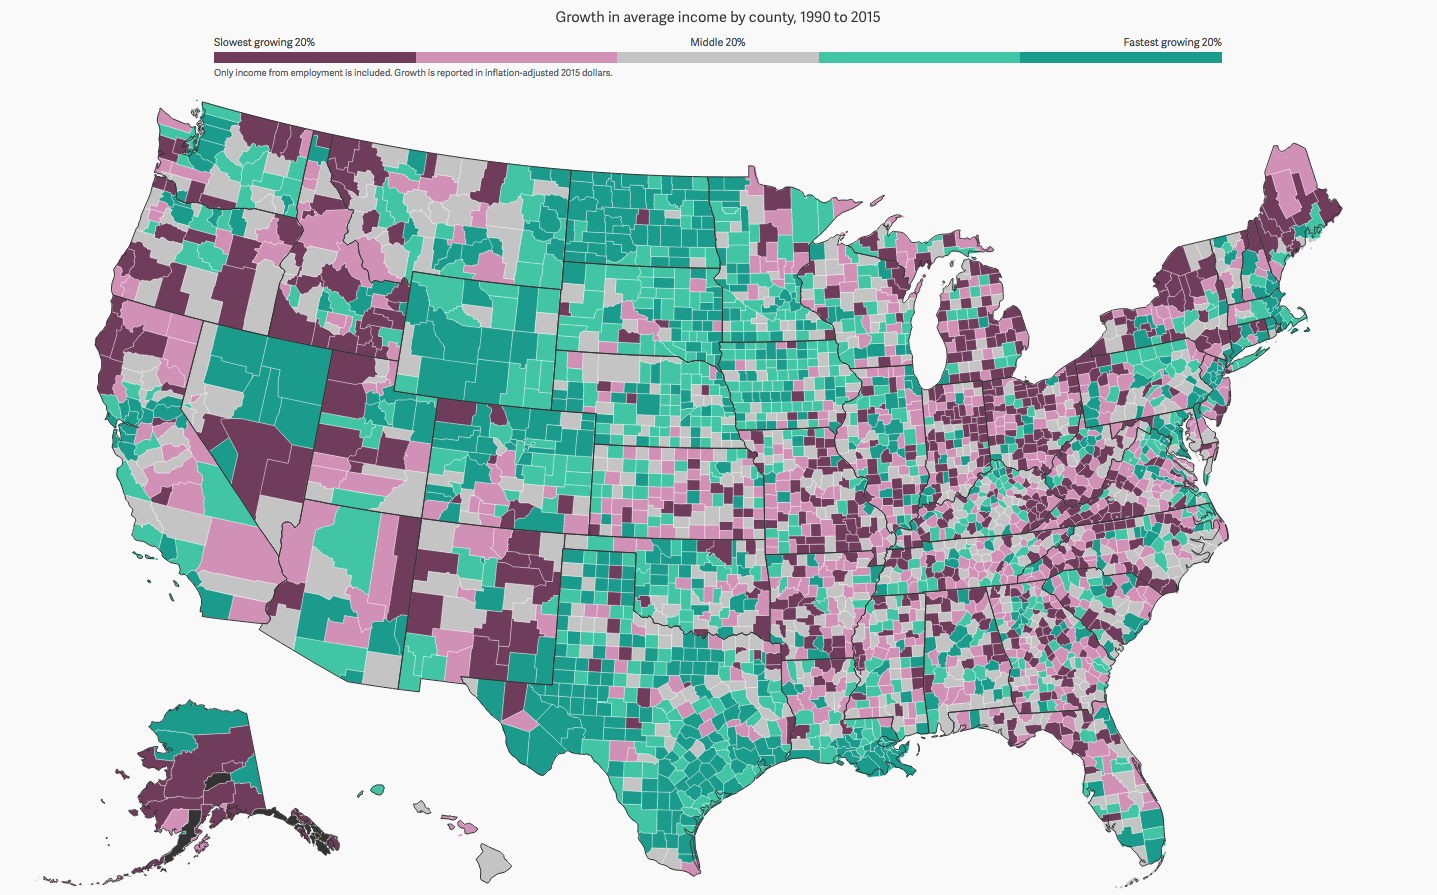
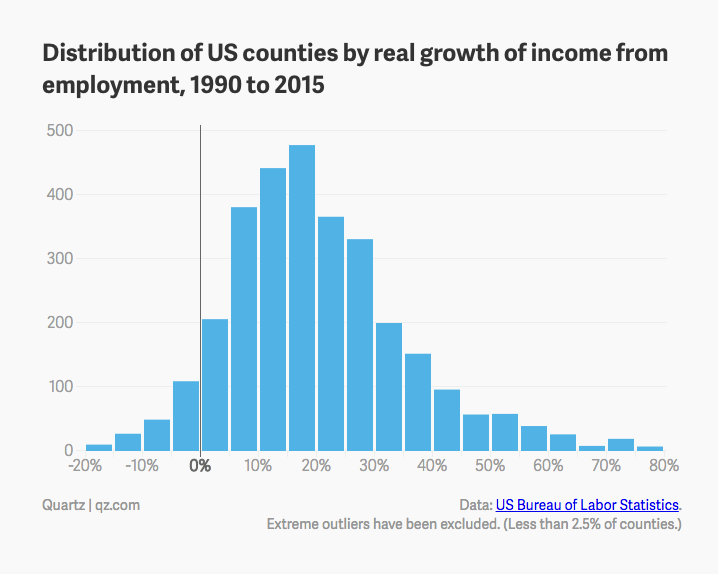
But, as you see in the map above, the national story belies the diverse experiences of most Americans. Only about a quarter of counties saw average wages grow within 5% of the national average. Some surged, while others sputtered—or even slipped into decline. (Employment income includes salary, as well as bonuses and non-cash compensation like meals. Insurance is excluded.)
The data used in this interactive come from the Quarterly Census of Employment and Wages (QCEW) collected by the U.S. Bureau of Labor Statistics. The dataset is unique because it is based on administrative data reported quarterly to state agencies as part of unemployment insurance programs. It allows us to look with precision at trends in geographic areas as small as counties.
The $72,000 inflation-adjusted increase in the average earnings of people in Goochland County, Virginia since 1990—the highest of any county—is not an estimate, like you might see in the US Census, but an average based on nearly all jobs in that county. The same goes for the $18,500 decrease in Monroe County, Ohio—the largest decline. (The data are based on what people earn working in a county; they do not necessarily live there, too.)
To a large degree, the story of American income growth over the past 25 years can be told by two states: Texas and New York. The decline of manufacturing, the march of globalization, the shale boom, the rise of finance and technology—the Empire and Lone Star states have seen it all.
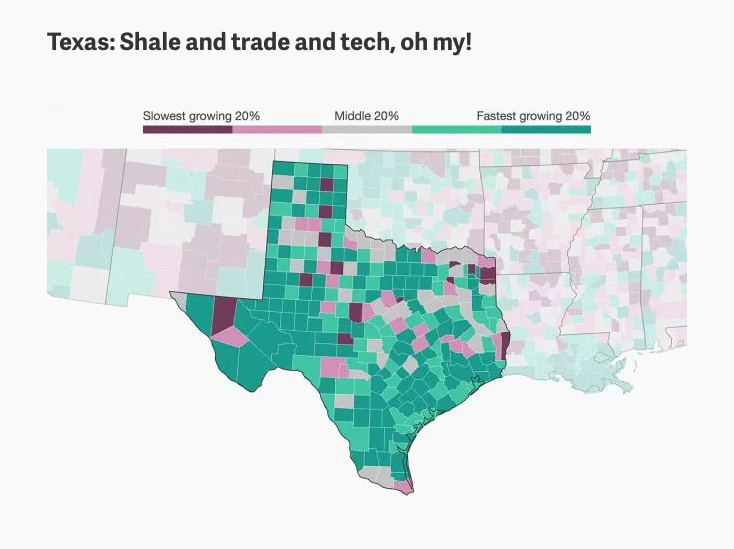
The economic boom in Texas, the second most populous state in the US, is remarkable and often under-appreciated. From 1990 to 2015, average incomes in Texas grew by 32%—or nearly 2% per year—the fifth-highest rate in the country. And this growth was, unusually, geographically widespread. Nearly 100 of Texas’s 255 countries were in the top quintile of growth nationally, and only 18 were in the bottom. From the borderlands to the metropolitan suburbs, Texas has shined.
The story of Texas’s growth over the past 25 years is built on the oil and gas boom. The local labor market has been one of the main beneficiaries of the “shale revolution“—the increased production of natural gas made possible by advances in horizontal drilling and hydraulic fracturing (also known as “fracking”). Some of the counties with the fastest wage growth in Texas are those around the Barnett and Eagle Ford shale formations. Counties in North Dakota, Oklahoma, and Louisiana similarly benefitted from the shale boom.
But the Texas story is about more than just fracking. Federal Reserve Bank of Dallas economist Pia Orrenius gets annoyed by this. “People’s expectations outside of Texas is that we’re still a poor state, we just live off of oil, we’re uneducated,” she says. “But over the last several decades there has been a diversification of the economy into really high-tech industry, with high-paying service sector and transportation jobs.”
Orrenius’s research shows that, even after plunging oil prices put a damper on drilling starting in 2014, the Texan economy has continued to outpace the rest of the country. Cities like Austin (Travis County) and Dallas (Dallas County) have become dynamic technology hubs. The state’s education and health industries have also grown rapidly.
What’s more, Texas is one of the biggest winners from globalization. While other southern states’ labor markets took a hit from NAFTA, Texas thrived. The counties along the Texas-Mexico border, though still relatively poor, were among the fastest-growing regions in the country in terms of wages over the past 25 years. Low value-added manufacturing jobs were replaced by transportation logistics, warehousing, and well-paying federal jobs in border security.
Free trade has come under fire lately, but you won’t find many complaints in Texas.
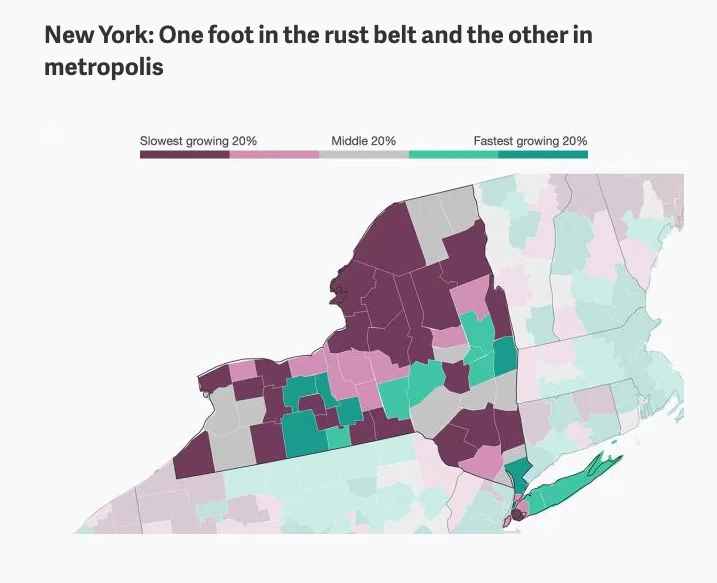
If Texas is the land of boomtowns, New York state is the home of the bust, with some of the poorest-performing counties in the nation.
However, because of one very important, eponymous city, New York state’s average wage growth was roughly the same as Texas since 1990, at 29% overall, or 1.7% per year. The vast majority of New York’s wage growth over this time was, unsurprisingly, centered in Manhattan, where wages grew by 59% overall, or 3.1% per year. In fact, earnings growth among workers in Manhattan accounted for nearly a quarter of all wage growth in the state. And within Manhattan, most of that growth was within finance, law, accounting, and other professional services.
It is a very different story outside of the New York City area.
“Upstate New York was in the path of this momentous loss of manufacturing jobs,” says Federal Reserve Bank of New York Economist Richard Deitz. “We had a lot of older, less productive manufacturing plants that were typical of the rustbelt, so the area was hit harder than most other parts of the country.” From cities like Rochester and Buffalo, to less-populated rural counties in the north of the state, the loss of factory jobs has hit the state hard.
For example, workers in Monroe County, where Rochester is located, earned $3,000 less in 2015 than they did in 1990, after adjusting for inflation. Big companies like Kodak and Xerox cut huge numbers of well-paying factory jobs in the city over this period. From 1997 to 2010, the number of manufacturing jobs in the city halved.
Most of the factory job losses upstate have been due to automation and, to a lesser extent, globalization. The jobs wiped out over the past 25 years were those that require few skills, with more technical jobs more likely to stick around. In most cases, machines replaced low-skilled machine operators. A smaller number of jobs were cut because local labor was too expensive relative to foreign alternatives.
Not all counties in upstate New York have stagnated. Like elsewhere in the U.S., the key to prosperity has been strength in technology, education, or government. Incomes in Tompkins County, home of Cornell University and Ithaca College, grew by almost 28% over the past 25 years. Albany County, home to government workers in the state capital, grew in line with the national average. In Rensselaer County, a hotbed for microchip manufacturing, incomes grew by over 35%, about the same as Westchester County, home to the poshest suburbs of New York City.
Keeping Things in Perspective
Maps can be deceiving. When we look at the country as a whole, perhaps the most eye-catching feature of the wage-growth map is the deep green of shale-rich North Dakota. But fewer than half as many people work in the whole of North Dakota as in Manhattan. That means the small green square of Manhattan is a far larger contributor to national wage growth than all of North Dakota. In general, smaller, more densely populated counties have performed better than large, sparsely populated ones.
There are other wrinkles. The QCEW data only includes average employment income, so it does not account for changes in the distribution of earnings. Since 1980 income gains have been strongest among top earners, so headline gains may mask the struggles of poorer workers.
Another limitation is that these data do not account for the changing composition of employment. At a national level, unemployment was at a similar level in 2015 as in 1990. But in a particular county, wages may have held up even though jobs were lost. Meanwhile, a different county may have gained jobs, but seen a fall in average incomes because workers shifted to lower-paying positions.
Finally, remember that our map shows relative income growth. Michigan is home to many counties in the bottom quintile of growth, yet the state ranks 19th in average income in the U.S., higher in absolute terms than states with faster wage growth like North Carolina and Oregon. (At least, before you account for the cost of living.)
The story of American incomes over the last 25 years is one of creative destruction. How creative and how destructive depends on where a worker lives. Some are fortunate enough to reside near technology hubs like Silicon Valley or North Carolina’s Research Triangle, education centers like Boston, or one of America’s large shale formations. Others suffer in cities devastated by the decline of low-skill manufacturing thanks to automation and globalization. But these broad narratives can’t account for the patchwork of failed factories, surprise discoveries, and smart investments that together form the landscape of the American economy.
NEXT STORY: How Will NCAA React to North Carolina’s ‘Humpty Dumpty’ H.B. 2 Repeal?